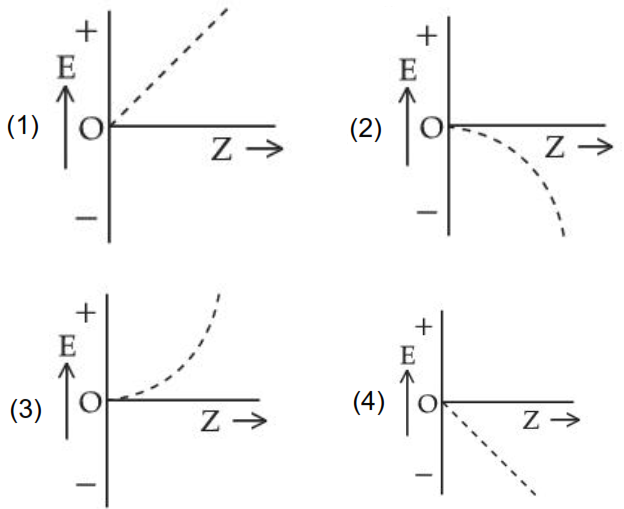
For hydrogen like species, which of the following graphs provides the most appropriate representation of E vs Z plot for a constant n ?
[ E : Energy of the stationary state,
Z : atomic number, $\mathrm{n}=$ principal quantum number]
Hello 👋 Welcome to Competishun – India’s most trusted platform for JEE & NEET preparation. Need help with JEE / NEET courses, fees, batches, test series or free study material? Chat with us now 👇